Capturing snapshots for historical graphs
Update (April 28, 2026): This article has been revised for clarity and additional notes based on further experience building snapshot-based systems.
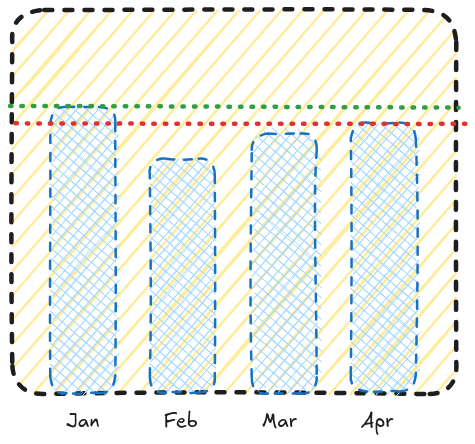
Graphs are essential components in any system that involves recording and analyzing data. They are visual representations of complex data organized in a way that makes it easier to read. Take for example: a graph that displays team throughput in the last 12 months. These are valuable to businesses as they help them forecast results and make timely, critical decisions.
However, designing graphs—particularly from the backend—can be very tricky and sometimes prone to integrity issues if not handled with care. Historical graphs are one of those that are deceptively difficult to build. Let's see why. I'll use the team's throughput graph as an example.
Note: I wrote this blog with the assumption that the system uses the application layer to decide when or how to persist data. Therefore, the SQL examples work with that rule in mind.
On-demand approach
A throughput graph typically shows the number of work items completed per time period (e.g., per week or per month). It can be used to track any entity (such as a team) to interpret trends and infer changes in output over time. For example, if a team completes 50 items in January and 90 items in May, that represents an 80% increase in throughput.
Here's the database setup for our example:
CREATE TABLE teams (
  id BIGSERIAL PRIMARY KEY,
  name VARCHAR NOT NULL,
  created_at TIMESTAMP NOT NULL DEFAULT NOW(),
  updated_at TIMESTAMP NOT NULL DEFAULT NOW()
);

CREATE UNIQUE INDEX index_users_on_email
ON users(email);

CREATE TABLE users (
  id BIGSERIAL PRIMARY KEY,
  email VARCHAR NOT NULL,
  password_digest VARCHAR NOT NULL,
  team_id BIGINT NOT NULL,
  created_at TIMESTAMP NOT NULL DEFAULT NOW(),
  updated_at TIMESTAMP NOT NULL DEFAULT NOW(),

  CONSTRAINT fk_users_teams
    FOREIGN KEY (team_id)
    REFERENCES teams(id)
    ON DELETE CASCADE
);

CREATE TABLE tasks (
  id BIGSERIAL PRIMARY KEY,
  title VARCHAR NOT NULL,
  completed_at TIMESTAMP,
  user_id BIGINT NOT NULL,
  created_at TIMESTAMP NOT NULL DEFAULT NOW(),
  updated_at TIMESTAMP NOT NULL DEFAULT NOW(),

  CONSTRAINT fk_tasks_users
    FOREIGN KEY (user_id)
    REFERENCES users(id)
    ON DELETE CASCADE
);
Here, teams have many users, and each user can be assigned one or more tasks. When a user completes a task, the corresponding record's completed_at field is set to the current time to reflect when the work was finished. Pretty easy to understand.
Now, if a company wants to analyze team throughput over the last 12 months, engineers need to design a system that aggregates task completion data so it can be visualized over time. One common approach is the on-demand approach.
An on-demand approach involves gathering raw data and transforming it into the desired output, in this case, counts per time period, at request time. In our example, the system must:
- Retrieve all completed tasks from the last 12 months by traversing from teams to users to tasks.
- Group the completed tasks by month using the
completed_atfield.
Here's how we do it:
WITH months AS (
  SELECT GENERATE_SERIES(
    DATE_TRUNC('month', CURRENT_DATE) - INTERVAL '11 months',
    DATE_TRUNC('month', CURRENT_DATE),
    INTERVAL '1 month'
  ) AS month
)
SELECT
  months.month,
  COALESCE(COUNT(tasks.id), 0) AS task_count
FROM months
  LEFT JOIN tasks ON DATE_TRUNC('month', tasks.completed_at) = months.month
  LEFT JOIN users ON users.id = tasks.user_id
  LEFT JOIN teams ON teams.id = users.team_id
WHERE tasks.completed_at IS NOT NULL
  AND tasks.completed_at >= DATE_TRUNC('month', CURRENT_DATE) - INTERVAL '11 months'
  AND teams.id = 1
GROUP BY months.month
ORDER BY months.month;
This query will then display this result for team ID 1:
     month      | task_count
----------------+------------
 2025-05-01     | 40
 2025-06-01     | 28
 2025-07-01     | 38
 ...
 2026-04-01     | 55
And it works, right?
Yes… until records start getting deleted. Once we introduce hard deletes, the graph can lose accuracy because historical data is no longer complete. The vulnerability lies in relying on raw task records.
For example, the graph might show 38 completed tasks for July 2025 as of today. If 5 of those tasks are deleted tomorrow, the graph will now show 33 completed tasks, which is a mismatch between what actually happened and what the system reports.
Whether records are removed accidentally or intentionally, the result is the same: the graph no longer reflects true throughput over time.
But what if the system doesn't hard delete records as part of its process? Many applications use soft deletes instead to avoid permanent data loss and support data resurrection.
For those unfamiliar, a soft delete marks a record as deleted (e.g., via a flag or timestamp) without actually removing it from the database. The record is then hidden from normal queries, unlike a hard delete, which permanently removes it.
For example:
-- Soft-deleting a task
UPDATE tasks
SET discarded_at = NOW()
WHERE id = 1;

-- Fetching "non-deleted" tasks
SELECT * FROM tasks WHERE discarded_at IS NULL;
In this situation, building the graph on demand still seems reasonable. However, it remains susceptible to data changes. Tasks can be reopened (completed_at = NULL) after completion, users can move between teams, and other updates can alter historical results.
Admittedly, these are simple examples that can be solved with proper database design, but handling all such cases reliably becomes increasingly complex as the system evolves. Over time, maintaining an accurate graph through on-demand queries becomes difficult, and performance can degrade as the dataset grows.
So what's the alternative?
Snapshot-based approach
A snapshot represents the state of a record at a specific point in time. It is treated as immutable, using insert-only and read-only constraints to ensure historical data is never altered.
A cron job is typically used to capture these snapshots at regular intervals. When generating the graph, the system no longer has to rely on raw data at query time—instead, it uses these precomputed snapshots.
Let's look at how we can implement this for the scenario described in the previous section.
First, we need a snapshot table that stores the number of completed tasks within the current day for each team:
CREATE TABLE completed_task_snapshot (
  id BIGSERIAL PRIMARY KEY,
  count INT NOT NULL,
  team_id BIGINT NOT NULL,
  captured_at DATE NOT NULL,
  created_at TIMESTAMP NOT NULL DEFAULT NOW(),
  updated_at TIMESTAMP NOT NULL DEFAULT NOW(),

  CONSTRAINT fk_completed_task_snapshots_teams
    FOREIGN KEY (team_id)
    REFERENCES teams(id)
    ON DELETE CASCADE
);

ALTER TABLE completed_task_snapshot
ADD CONSTRAINT unique_team_day
UNIQUE (team_id, captured_at); -- To prevent double-counting
Then, we introduce a cron job that runs every midnight to get the necessary data to create the snapshot. The queries inside the cron job would look like this:
-- Count the total number of completed tasks for the current day for team ID 1
SELECT COUNT(id)
FROM tasks
WHERE team_id = 1
  AND completed_at >= DATE_TRUNC('day', "2026-04-19"::timestamp)
  AND completed_at < DATE_TRUNC('day', "2026-04-19"::timestamp) + INTERVAL '1 day';

-- Create the snapshot for that day
INSERT INTO completed_task_snapshot (count, team_id, captured_at)
VALUES (4, 1, '2026-04-19'::date)
ON CONFLICT (team_id, captured_at)
DO UPDATE SET count = EXCLUDED.count;
And finally, we fetch the snapshots to visualize the team's throughput using this query:
WITH months AS (
  SELECT GENERATE_SERIES(
    DATE_TRUNC('month', CURRENT_DATE) - INTERVAL '11 months',
    DATE_TRUNC('month', CURRENT_DATE),
    INTERVAL '1 month'
  ) AS month
),
team_monthly AS (
  SELECT
    DATE_TRUNC('month', captured_at) AS month,
    SUM(count) AS total_completed
  FROM completed_task_snapshot
  WHERE completed_task_snapshot.team_id = 1
    AND completed_task_snapshot.captured_at >= DATE_TRUNC('month', CURRENT_DATE) - INTERVAL '11 months'
  GROUP BY DATE_TRUNC('month', completed_task_snapshot.captured_at)
)
SELECT
  m.month,
  COALESCE(tm.total_completed, 0) AS total_completed
FROM months m
LEFT JOIN team_monthly tm
  ON tm.month = m.month
ORDER BY m.month;
Notice how we achieved the same result as the on-demand approach. This time, the graph's integrity is preserved even if tasks are deleted or reopened, users change teams, or other data changes occur. None of these affect the snapshots due to their immutability constraints.
So we can confidently say this is the superior approach, right?
Well… not quite.
This approach requires capturing snapshots on a regular schedule to build the graph over time. If it is introduced later—let's say, months after the feature already exists—there will be no historical snapshot data for earlier periods, resulting in gaps in the graph.
It also introduces a flexibility limitation. If we want to support filtering on the graph, we need to define those dimensions upfront. For example, adding a user-level filter would require storing user_id in the snapshot table, effectively changing the design from a team-level snapshot to a per-user snapshot.
For example:
-- Assuming the table already has `user_id`
-- Count the total number of completed tasks for the current day for user ID 1
SELECT COUNT(id)
FROM tasks
WHERE user_id = 1
  AND completed_at >= DATE_TRUNC('day', "2026-04-19"::timestamp)
  AND completed_at < DATE_TRUNC('day', "2026-04-19"::timestamp) + INTERVAL '1 day';

-- Create the snapshot for that day
INSERT INTO completed_task_snapshot (count, team_id, user_id, captured_at)
VALUES (4, 1, 1, '2026-04-19'::date)
ON CONFLICT (team_id, user_id, captured_at) -- Constraint now includes user_id
DO UPDATE SET count = EXCLUDED.count;
This can be hard to deal with especially when the system has months of snapshots in the database.
"How do we dissassemble the existing snapshots from per-team to per-user?"
"What if users moved between teams across the periods?"
These are some of the questions that you will have to address when introducing a new dimension. That is why, with this approach, you effectively need to define graph filters upfront, since the snapshot schema must include all required dimensions from the start.
This can be limiting in many systems especially when new perspectives are needed later. Often, the solution is simply to create a different graph for that new view of the data.
So, which approach should engineers take?
On-demand vs Snapshot (quick comparison)
To summarize both approaches:
The on-demand approach is flexible and always reflects the latest state of the data. However, it can become expensive and unreliable over time as data changes and complexity increases.
The snapshot approach, on the other hand, provides stable and predictable historical data by precomputing results ahead of time. The tradeoff is reduced flexibility and the need to define dimensions and structure upfront.
In practice, the choice depends on the use case. Systems that prioritize accuracy and performance for historical reporting tend to favor snapshots, while systems that require maximum flexibility often stick with on-demand queries.
In some cases, a hybrid approach is used—combining precomputed snapshots for common queries with on-demand computation for dynamic or less frequently accessed views.
Takeaway
If there's one lesson from all of this, it's that designing historical graphs is hard. It is less about finding the “correct” approach and more about understanding the tradeoffs you're willing to make.
I've personally built a historical graph using the snapshot approach, and aside from the limitations stated previously, one difficult point is making users understand why the graph has months of gaps and why it takes time to reflect trends. Things can also get messy when you consider how to structure and collect data for snapshots—and systems are already messy themselves. I think we can all agree on that at least.
Thanks for reading my blog! I took some time writing this so I appreciate you for reading the whole thing. Till next time!